On Broadway

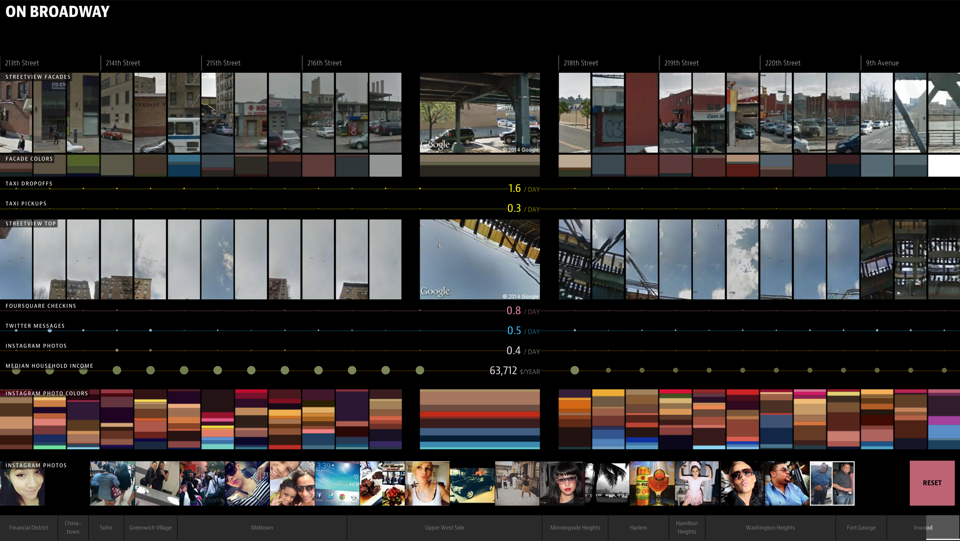
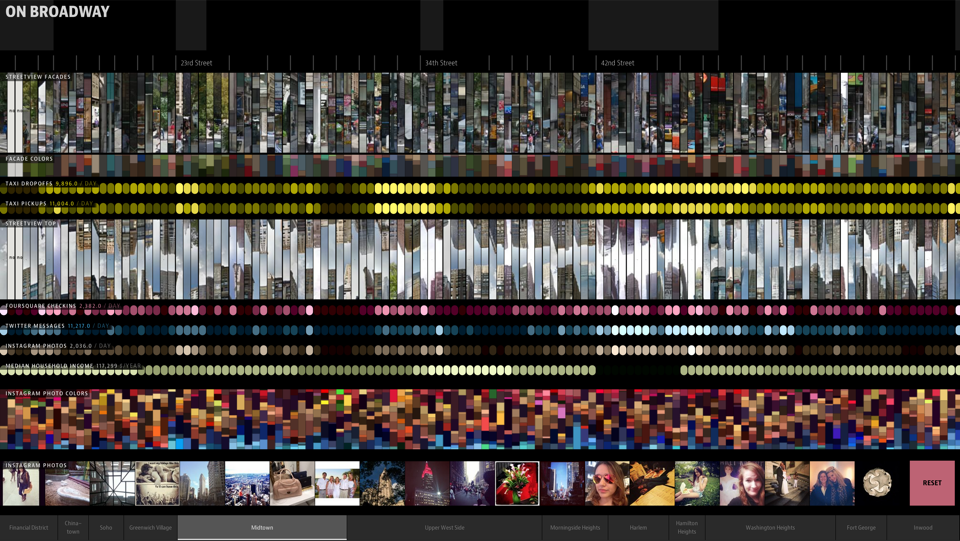
The interactive installation On Broadway represents life in the 21st century city through a compilation of images and data collected along the 13 miles of Broadway that span Manhattan.

The result is a new type of city view, created from the activities of hundreds of thousands of people.

A project by Daniel Goddemeyer, Moritz Stefaner, Dominikus Baur, and Lev Manovich.

Read more View video Open the application *
* Only recommended on fast machines with large display

Representing the modern city

Modern writers, painters, photographers, filmmakers and digital artists have created many fascinating representations of the city life. Paintings of Paris boulevards and cafés by Pissarro and Renoir, photomontages by Berlin Dada artists, Broadway Boogie-Woogie by Piet Mondrian, Spider-Man comics (Stan Lee and Steve Ditko), Playtime by Jacques Tati, and Locals and Tourists data maps by Eric Fischer are just some of the classic examples of artists encountering the city.

The artwork which directly inspired our project is Every Building on the Sunset Strip by Edward Ruscha (1966). It is an artist book which unfolds to 25 feet (8.33 meters) to show continuous photographic views of both sides of a 1.5 mile section of Sunset Boulevard.

Every Building on the Sunset Strip by Edward Ruscha (1966)

The data street

Today, a city “talks” to us in data.

Many cities make available datasets and sponsor hackathons to encourage creation of useful apps using their data. Locals and tourists post messages and media which include their locations on Twitter, Instagram, and other social networks. How can we use these new information sources to represent the 21st century city?

The map points used for collecting the data.
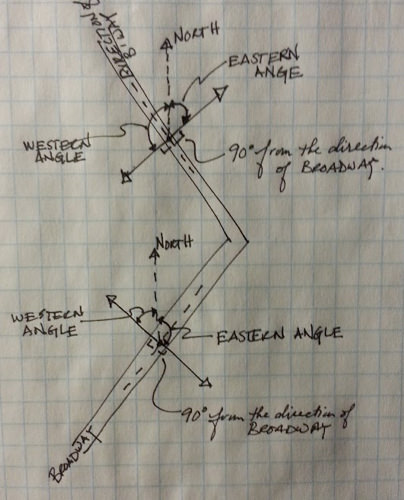
A sketch illustrating the point selection process and point metadata
(by Leah Meisterlin)
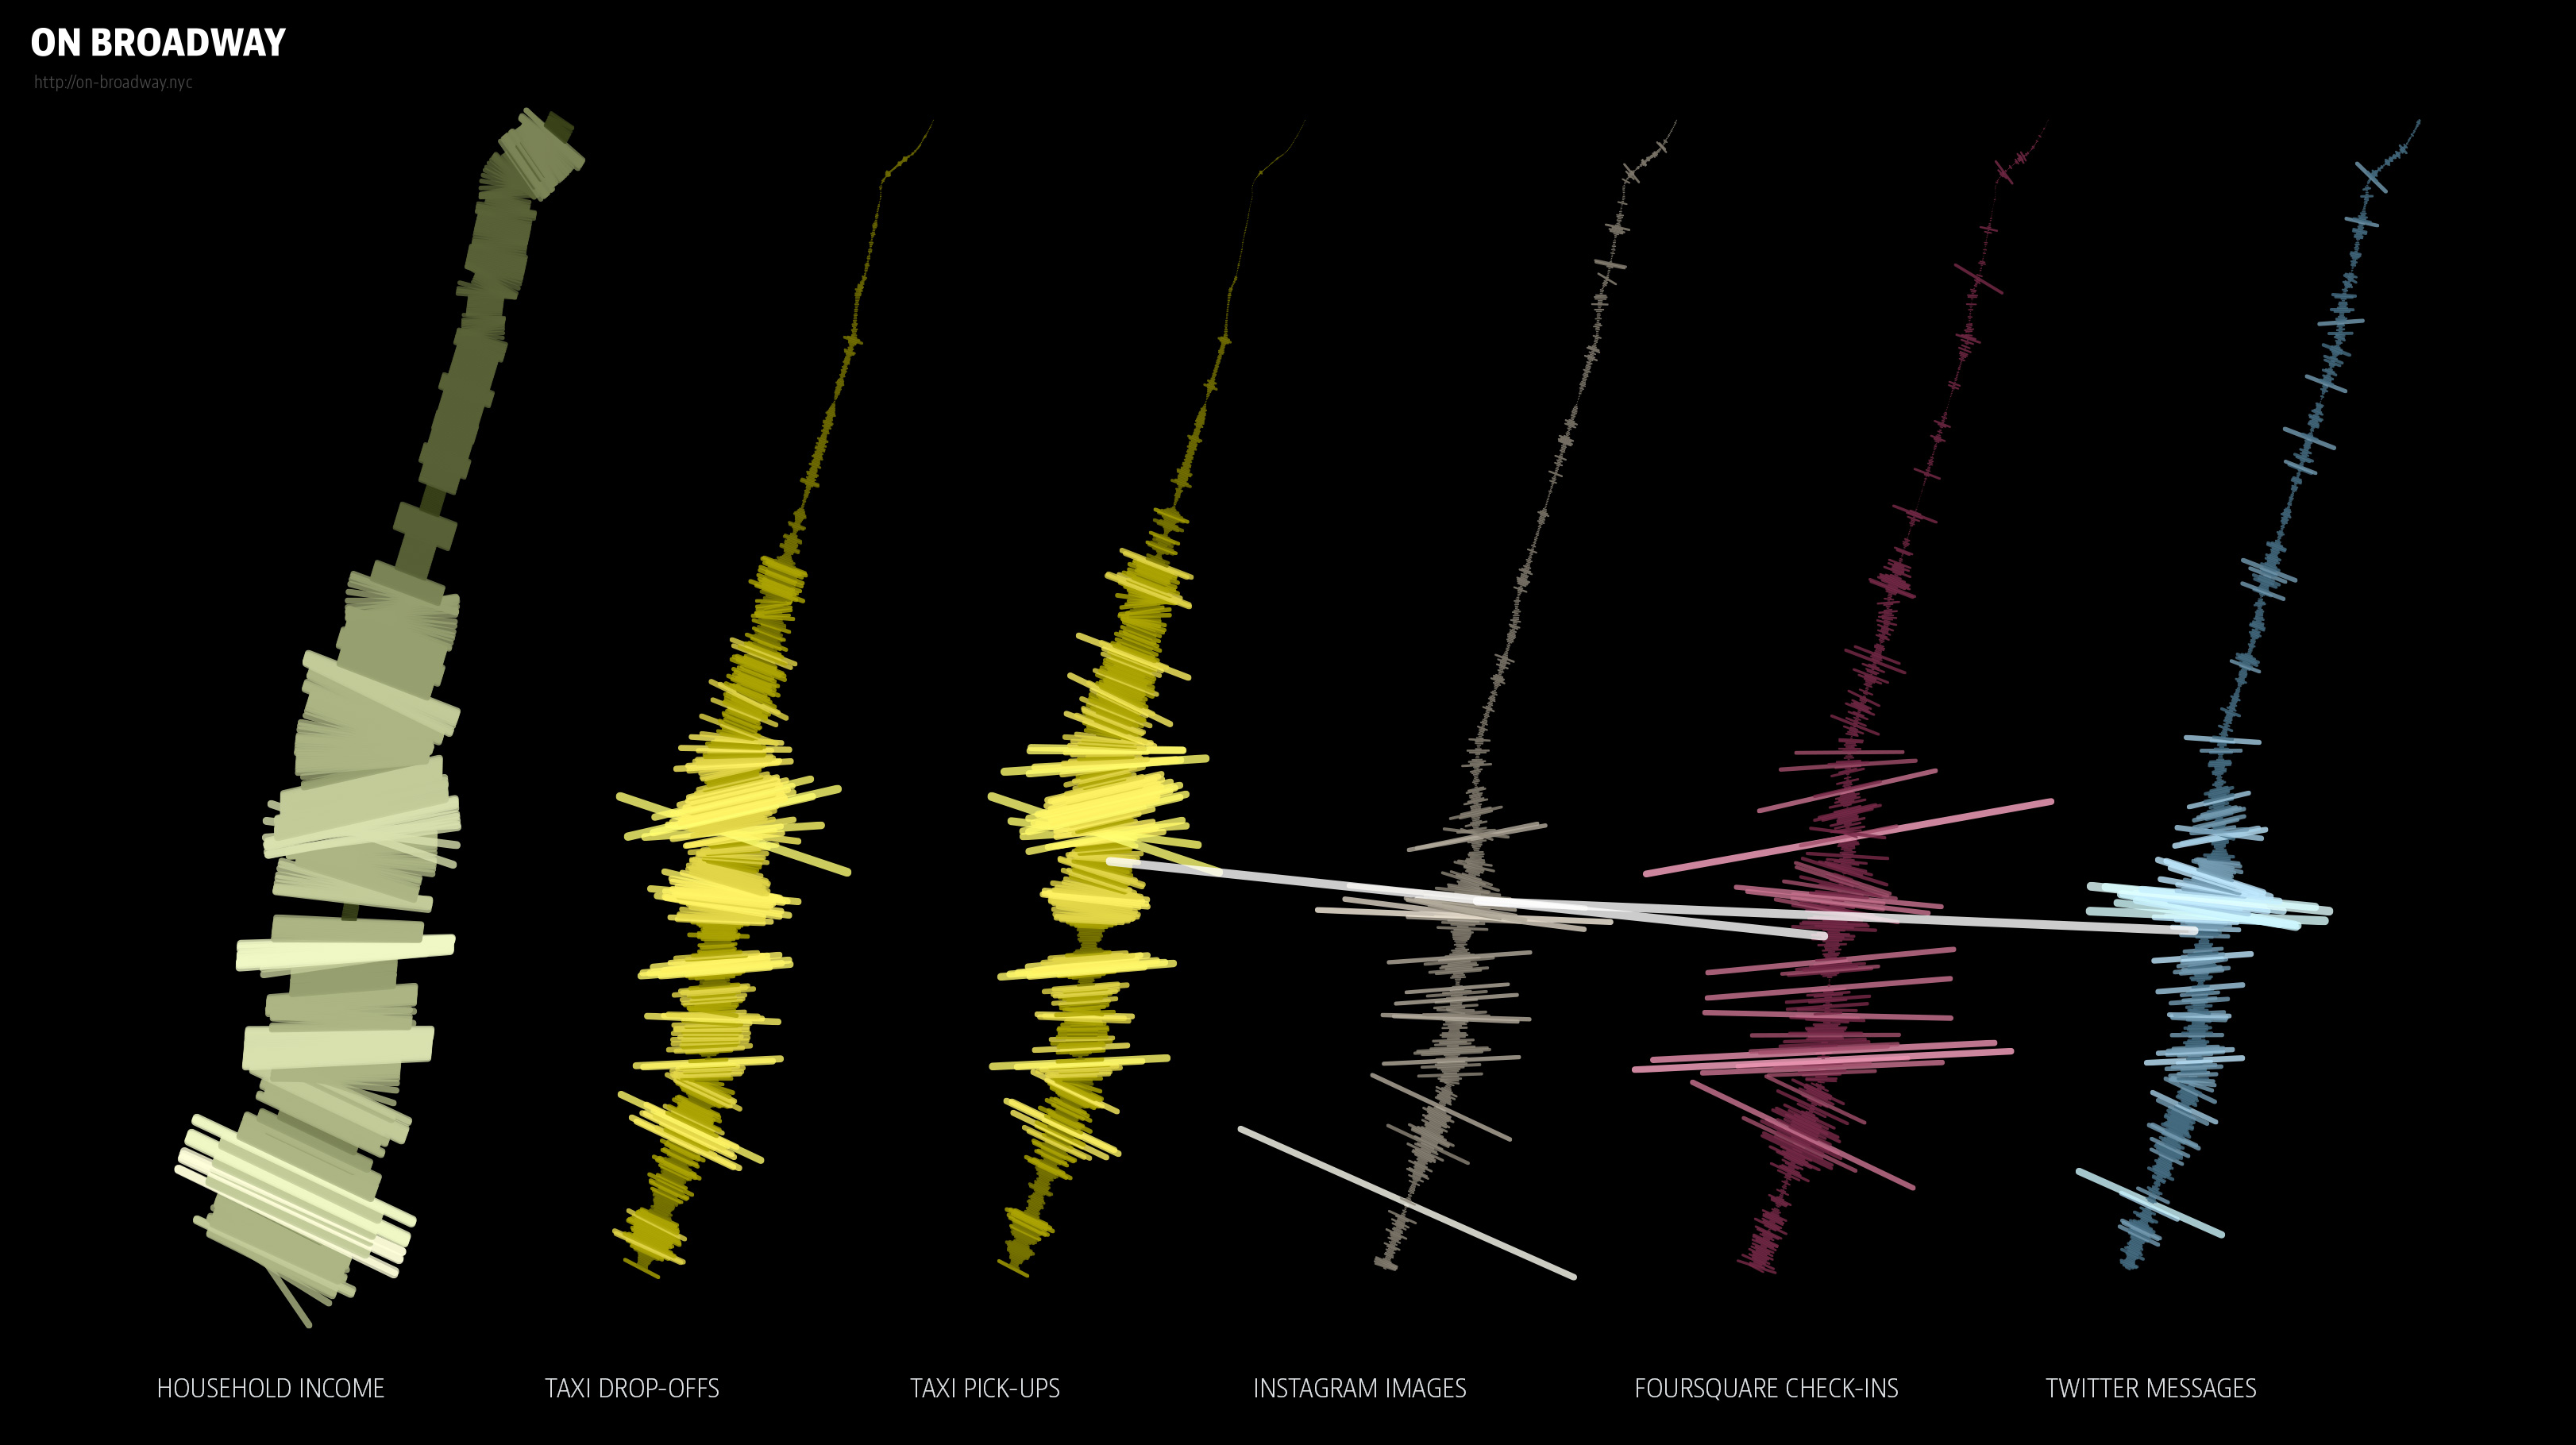
Initial plots exploring the juxtaposition of various data layers

In our project we focus on a single street in NYC: Broadway.

Like a spine in a human body, Broadway runs through the middle of Manhattan Island curving along its way. We wanted to include a slightly wider area than the street itself so we can capture also the activities nearby. To define this area, we selected points at 30 meter intervals going through the center of Broadway, and made 100 meter wide slices centered on every point. The result is a spine-like shape that is 21,390 meters (13,5 miles) long and 100 meters wide. We used the coordinates of this shape to filter the data we obtained for all of NYC, as described below.

Instagram images and their data (locations, date and time, tags, and descriptions) were downloaded in Manovich’s lab in real time over 158 days in 2014. For Google Street View images, we were limited to the times Google photographed the Broadway. All other data sources are used to calculate averages per Broadway area, and therefore in some cases we used longer periods when such data was available.

Image and data include 660,000 Instagram photos shared along Broadway during six months in 2014, Twitter posts with images, Foursquare check-ins since 2009, Google Street View images, 22 million taxi pickups and drop-offs in 2013, and economic indicators from US Census Bureau (2013).


Data sources details

Instagram: Using the services provided by Gnip, we downloaded all geo-coded Instagram images publicly shared in larger NYC area between February 26 and August 3, 2014. The dataset contains 10,624,543 images, out of which 661,809 are from Broadway area.

Twitter: As a part of Twitter Data Grant awarded to Software Studies Initiative, we received all tweets with images shared worldwide during 2011-2014. We filtered this dataset, leaving only tweets shared inside Broadway area during the same time period as we used for Instagram (158 days in 2014).

Foursquare: We downloaded Foursquare data for March 2009 - March 2014 (1826 days) through the foursquare API. Overall, we counted 8'527'198 check-ins along Broadway.

Taxi: Chris Whong obtained NYC 2013 data for taxi pickups and drop-offs from NYC Taxi and Limousince Comission (TLC). In 2013 there have been 140 million trips in Manhattan. Filtering this dataset using Broadway coordinates left us with 22 million trips (10,077,789 drop-offs and 12,391,809 pickups).

Economic indicators: We used data for 2013 from American Community Survey (ACS), a yearly survey of the sample of the U.S. population by US Census Bureau. ACS reports the data summarized by census tracts. Our 713 Broadway slices (30 m x 100 m) lie within 73 larger tracts. In view of this limitation, we are only including a single economic indicator from ACS 2013: estimated average household income.


Data — Patterns and Findings

1One street, two cities

Our collected data divides Broadway into two very different parts. The first part (we will call it “Broadway 1”) stretches from the Financial District to 110th Street; the second part (we will call it “Broadway 2”) covers the part from 110th Street to the northern tip of Manhattan. Broadway 1 has much more social media activity, more taxi rides, and more photos by tourists than Broadway 2.

2 A city of correlations

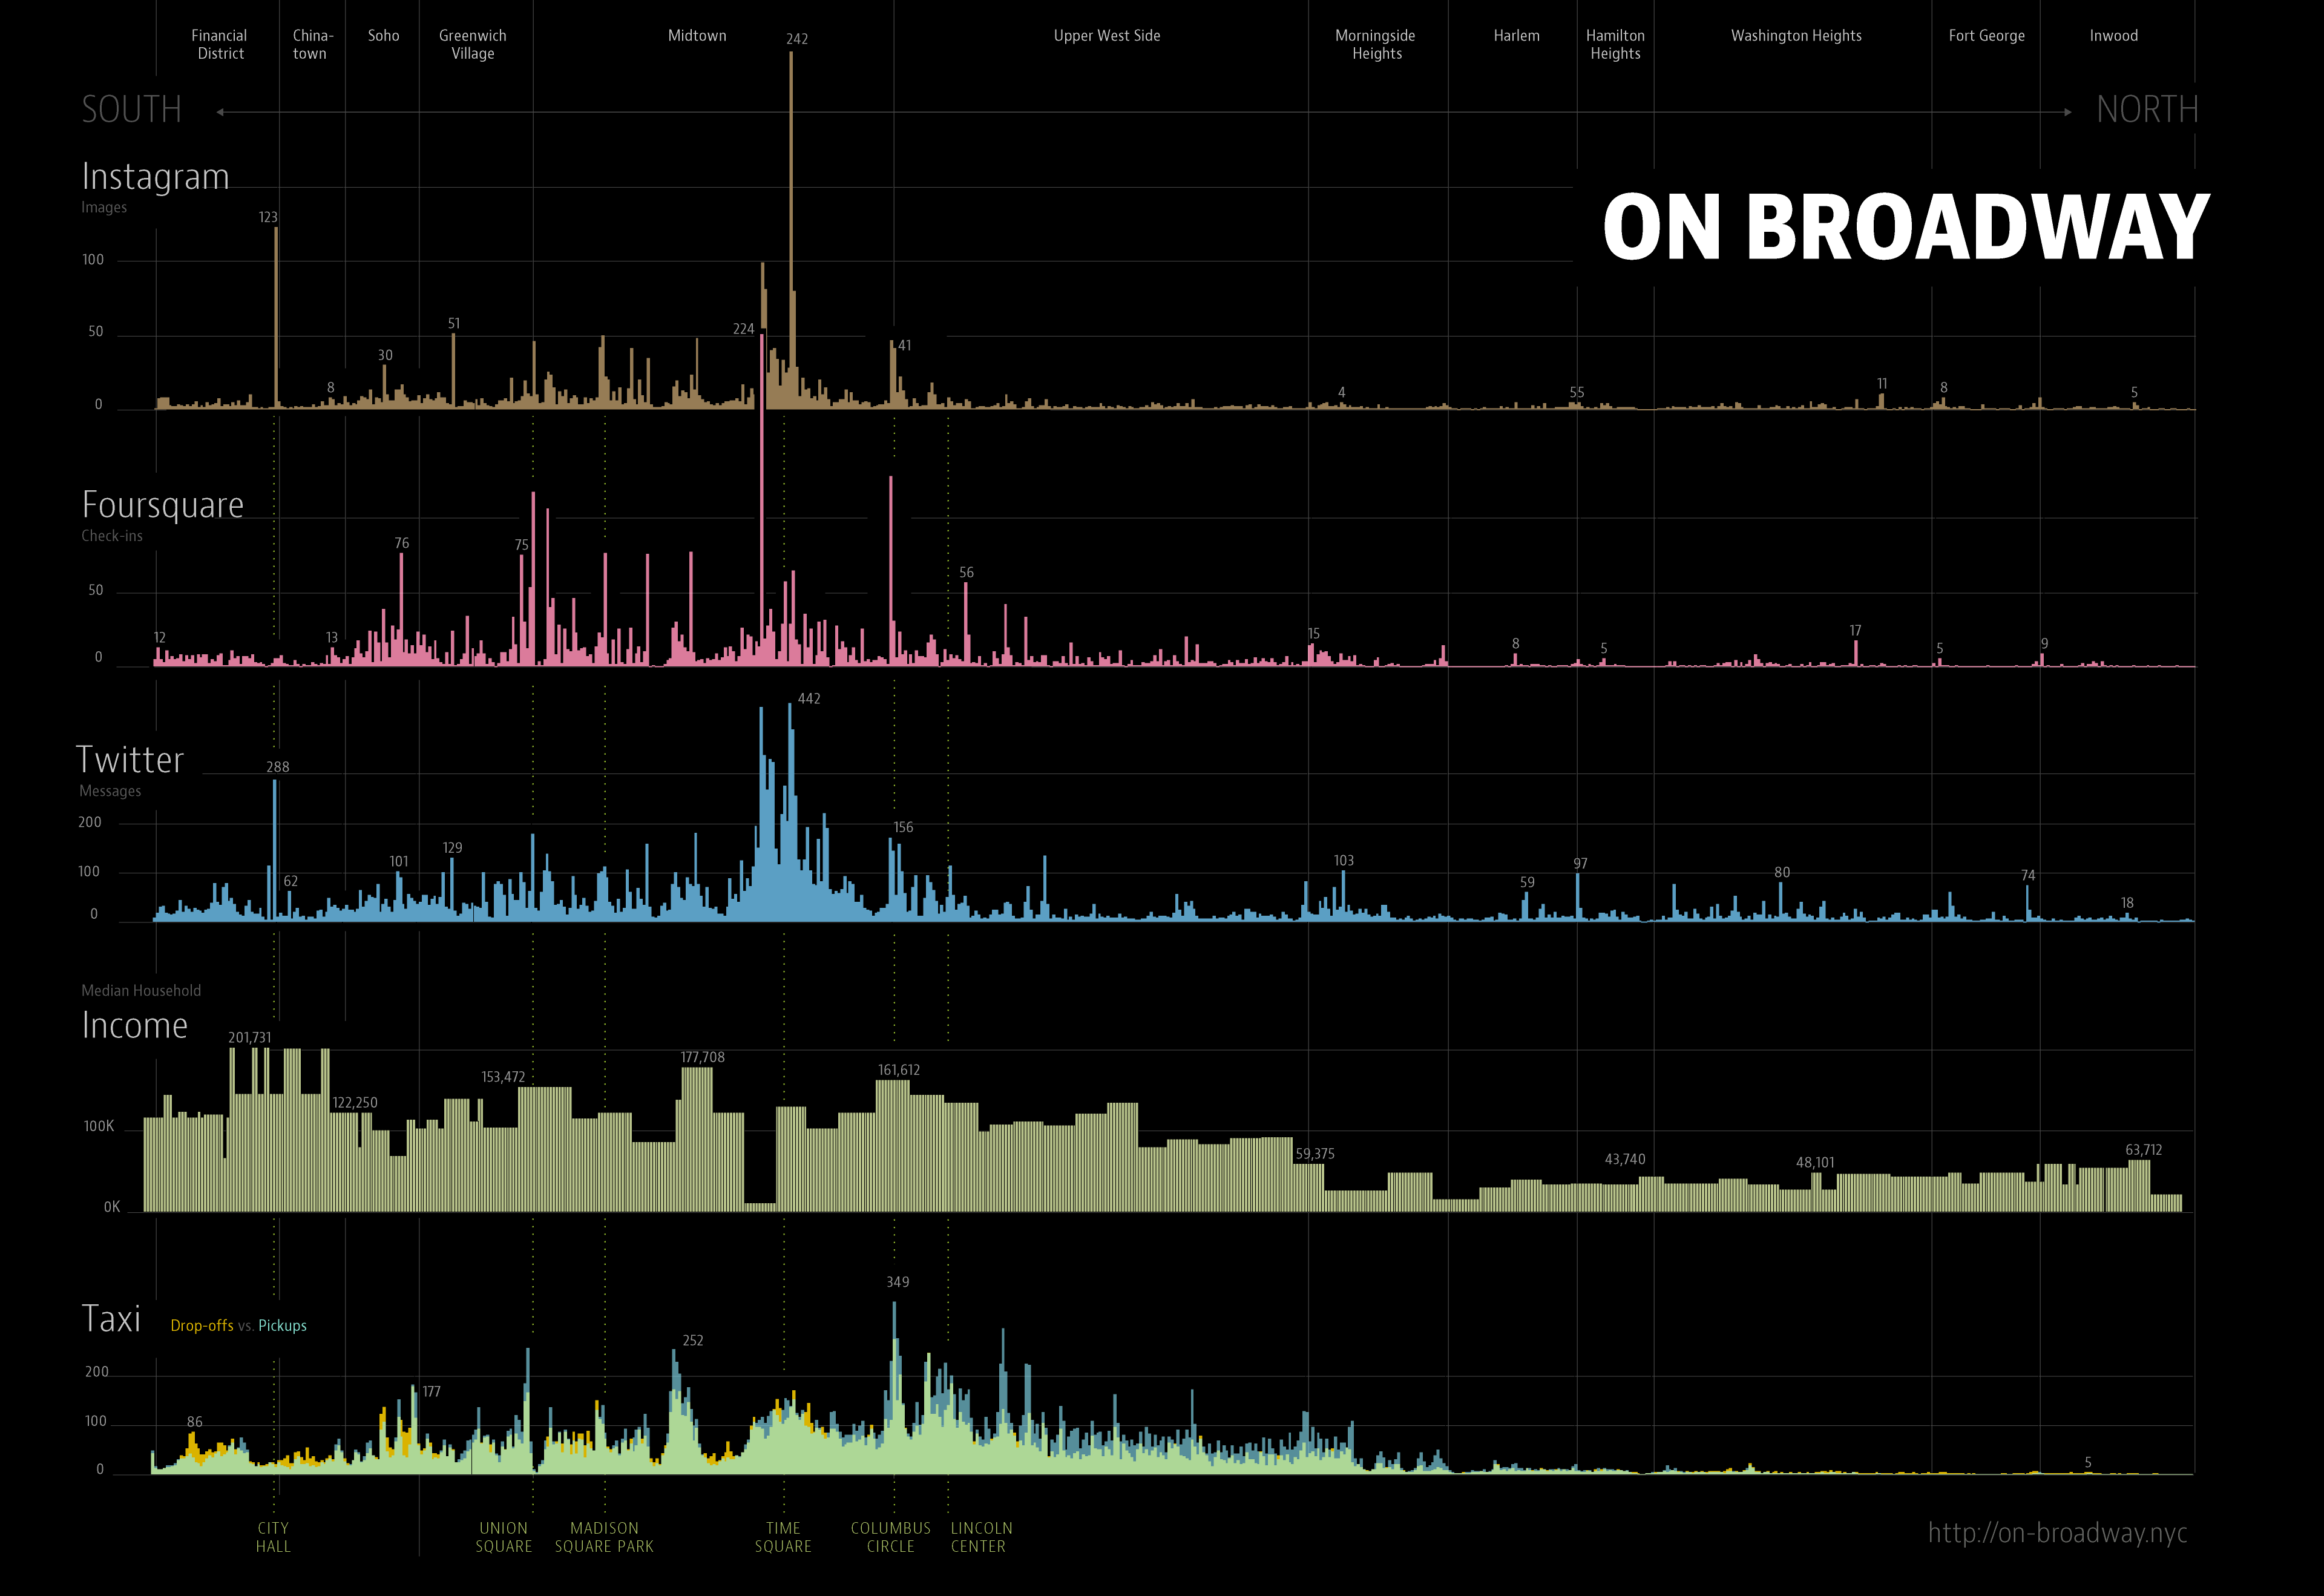
All variables we analyzed have positive correlations. Informally this can be seen on the graph on the left: the plotted variables go up and down together.

The early 21st century megacity is synchronized and coordinated, like the dream of a modernist architect which got realized. In his 1923 book Toward an Architecture, Le Corbusier defined a modern house: “A house is a machine for living in.” A century later, the whole city acts as a kind of machine, if we examine different variables.

But there is also a different way to interpret this “correlated city.” Social inequality and digital divide are now joined by a social media divide which is even more extreme. In affluent areas, people make more money, take taxi, and post images on Instagram and Twitter. In poor areas, people make less money, rarely use taxi, and post much fewer images on social networks.

3 Tourists are coming!

Since Broadway passes through a number of famous landmarks and also areas popular with tourists like SoHo, we can assume that a significant proportion of shared images in these areas come from tourists. Using the locations of images shared on Instagram along Broadway during six months in 2014, we identified 4 most active areas. All these areas correspond to public parks or squares, and three out of four correspond to tourist landmarks. (Examining the content of shared images confirms that indeed many of them show these landmarks and are likely to be taken by city visitors. The top areas in terms of images shared on Twitter are similar: parts of Time Square and City Hall Park.)

Area % of Instagram images
Time Square between 46th and 47th Street8.7%
Time Square and 43rd Street4.8%
City Hall Park (Chambers and Broadway)3.3%
Madison Square Park (23rd-24th Street, Flatiron Building) 2.4%

Together, these four areas account for almost %20 of all shared Instagram images. This is more than all images shared along Broadway 2.


Installation

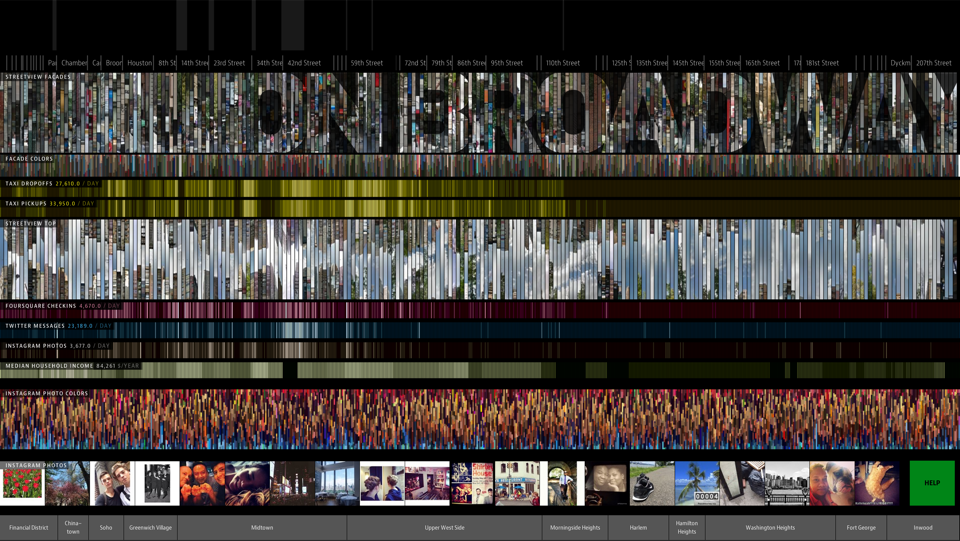
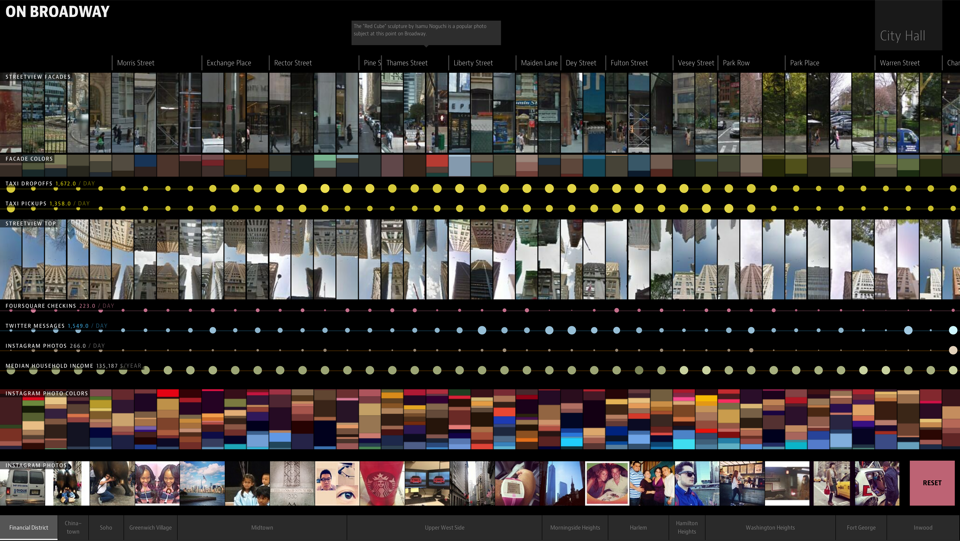
The result of our explorations is On Broadway: a visually rich image-centric interface, where numbers play only a secondary role, and no maps are used. The project proposes a new visual metaphor for thinking about the city: a vertical stack of image and data layers.

There are 13 such layers in the project, all aligned to locations along Broadway. As you move along the street, you see a selection of Instagram photos from each area, left, right, and top Google Street View images and extracted top colors from these image sources.

We also show average numbers of taxi pickups and drop-offs, Twitter posts with images, and average income for the parts of the city crossed by Broadway. To help with navigation, we added additional layers showing names of Manhattan neighborhoods crossed by Broadway, cross-streets and landmarks.


Open the application *

* Only recommended on fast machines with large display

Contact

onbroadway.nyc@gmail.com

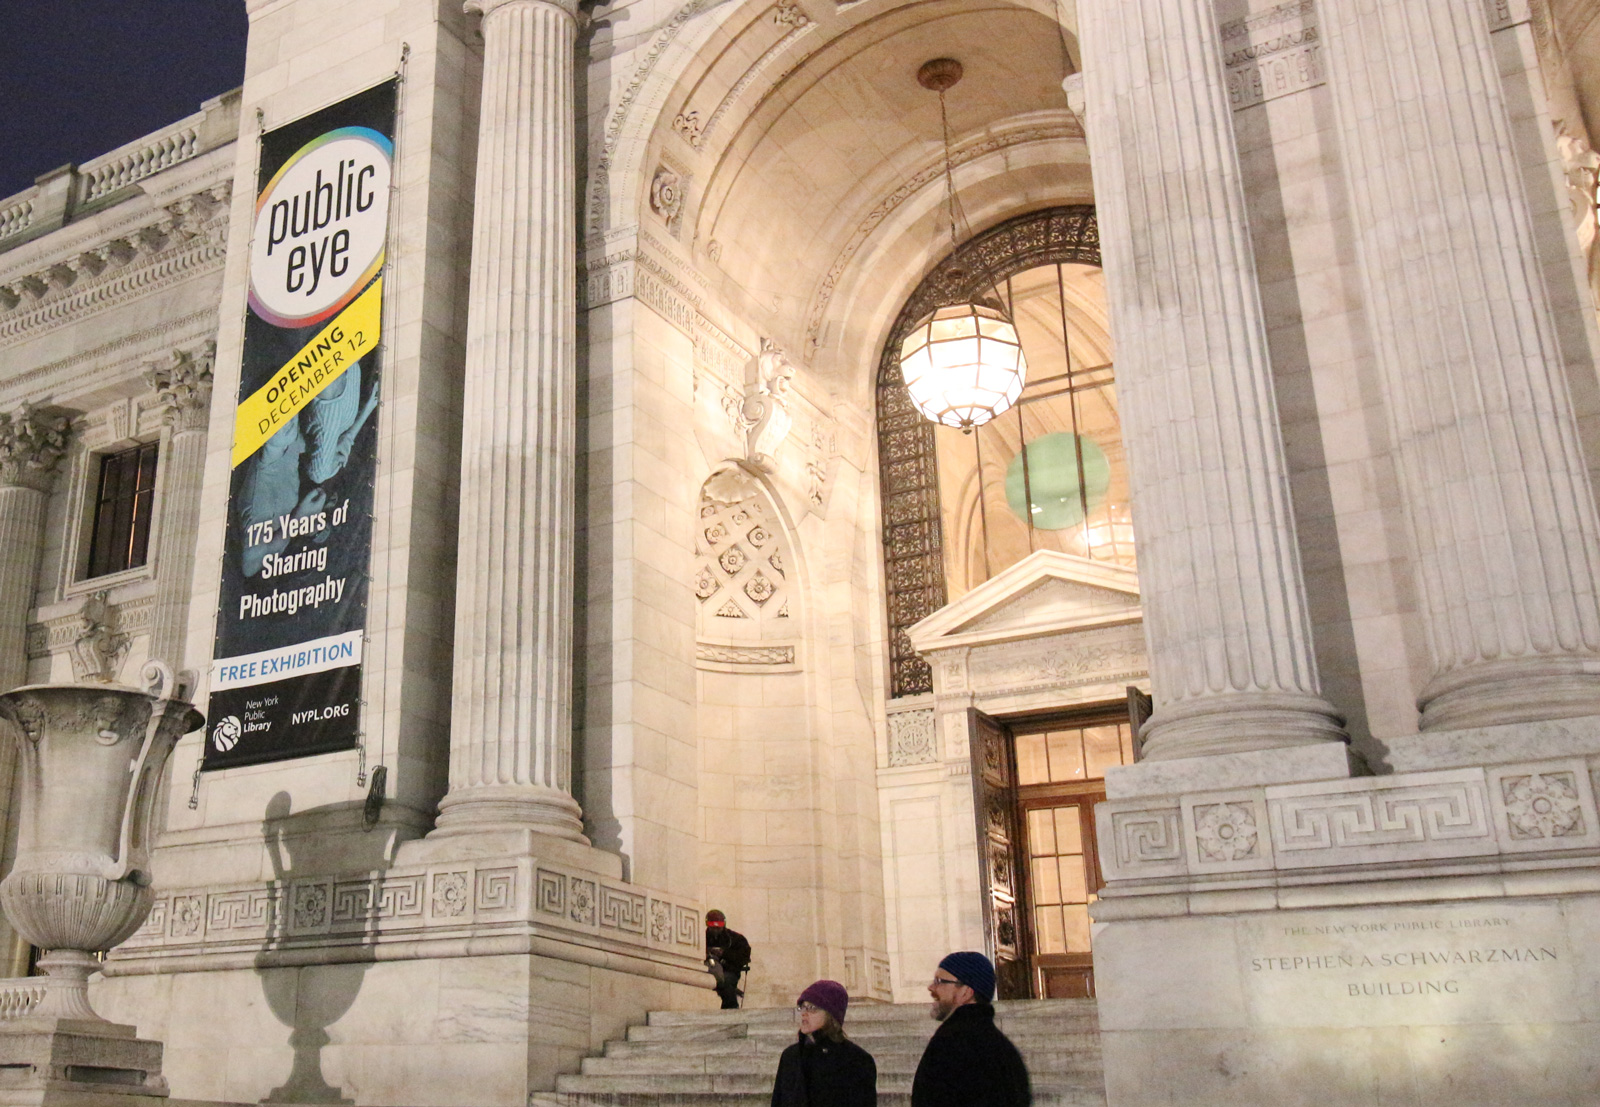
Download press material


Media contacts: Tanya Domi, Director, Media Relations, The Graduate Center, CUNY. Phone: (212) 817-7283. Email: tdomi@gc.cuny.edu

Project coordinator: Lev Manovich, Professor, The Graduate Center, CUNY; Director, Software Studies Initiative. Email: manovich.lev@gmail.com


Contributors

Software Studies Initiative (Mehrdad Yazdani, Jay Chow), Brynn Shepherd and Leah Meisterlin, PhD students at The Graduate Center, City University of New York (Agustin Indaco, Michelle Morales, Emanuel Moss, Alise Tifentale).


The project uses software tools developed by Software Studies Initiative with the support from The Andrew W. Mellon Foundation and National Endowment for Humanities.


Exhibitions


Coverage / related media